Why Can't I Tell Which Plant Is Really Struggling with Downtime?
Laszlo Habensusz
المؤلف
It's 2 PM on a Tuesday, and the phone rings. It's Mark, the foreman from the Springfield fabrication plant, reporting the Haas VF-2 CNC mill is down again. Spindle bearings, he thinks. This is the third time this month. You just got off the phone with Sarah at the Lakeside plant, who mentioned their Amada HFE M2 220 press brake is acting up too, but it sounds like a minor sensor issue. Mark's plant always seems to have more critical breakdowns, more urgent calls, more unexpected costs. But is it actually worse, or just louder? You need to know which plant is genuinely struggling with downtime and maintenance costs, not just which foreman shouts loudest. The problem is, with different reporting methods, different ways of logging issues, and different definitions of "urgent," it’s nearly impossible to get a true, apples-to-apples comparison across your sites.
The core issue is a lack of standardized data. Springfield might track downtime on a spreadsheet, noting machine names and start/stop times. Lakeside might use a whiteboard in the breakroom, with technicians scribbling notes. Head office gets a monthly email summary from each, often with different metrics or incomplete details. One plant counts "setup time" as downtime, another doesn't. One logs every small adjustment, the other only major failures. This inconsistency makes it impossible to compare actual asset health, technician workload, or maintenance spending effectively. You can't make informed decisions about where to invest in new equipment, training, or process improvements if you can't trust the data.
Without a unified system, your maintenance leads are flying blind. They might see a flurry of work orders for the Haas VF-2 at Springfield, but they don't know if that's because the machine is truly a lemon, or if Springfield just has a more diligent reporting culture. Conversely, the seemingly quieter Lakeside plant might be hiding significant deferred maintenance that’s about to blow up, simply because minor issues aren't being logged consistently. This isn't just about comparing numbers; it's about identifying real operational bottlenecks, recognizing patterns of failure, and ensuring resources are allocated where they're most needed to prevent costly disruptions across your entire operation.
Getting a Clear, Comparable View Across All Your Fabrication Plants
Let's revisit that Tuesday afternoon and see how a unified multi-site premises management system changes things. You're no longer relying on phone calls and disparate reports; you're looking at a single dashboard that pulls data from both Springfield and Lakeside, standardizing how information is collected and presented.
The Haas VF-2 at Springfield
When the Haas VF-2 goes down at Springfield, the operator immediately logs a new work order directly into the iTenance system via a tablet at the machine. They select the "Haas VF-2 CNC Mill" from the asset registry for the Springfield location, describe the issue as "Spindle bearings rough, excessive vibration," and set the priority to "Critical - Production Down."
- System Action: The system automatically records the downtime start time, associates the work order with the specific asset at the Springfield premises, and triggers a notification to the Springfield maintenance team lead and the central operations manager.
- Data Capture: This work order becomes part of the Haas VF-2's complete asset history. All subsequent actions – diagnosis, parts used (pulled from Springfield's spare parts inventory), technician assignment, and repair completion – are logged against this single digital record.
The Amada HFE M2 220 at Lakeside
Meanwhile, at Lakeside, the operator notices inconsistent bends on the Amada HFE M2 220 press brake. They suspect a sensor issue and log a work order through their tablet, selecting the "Amada HFE M2 220 Press Brake" for the Lakeside premises. They describe the issue as "Inconsistent bend angle, suspected faulty sensor," and set it as "High Priority - Production Impacted."
- System Action: Similar to Springfield, the system captures the details, associates it with the Lakeside asset, and notifies the Lakeside team lead.
- Data Capture: The repair details, including any parts ordered or replaced from Lakeside's inventory, are added to the Amada's asset history.
The Unified View: Comparing Springfield vs. Lakeside
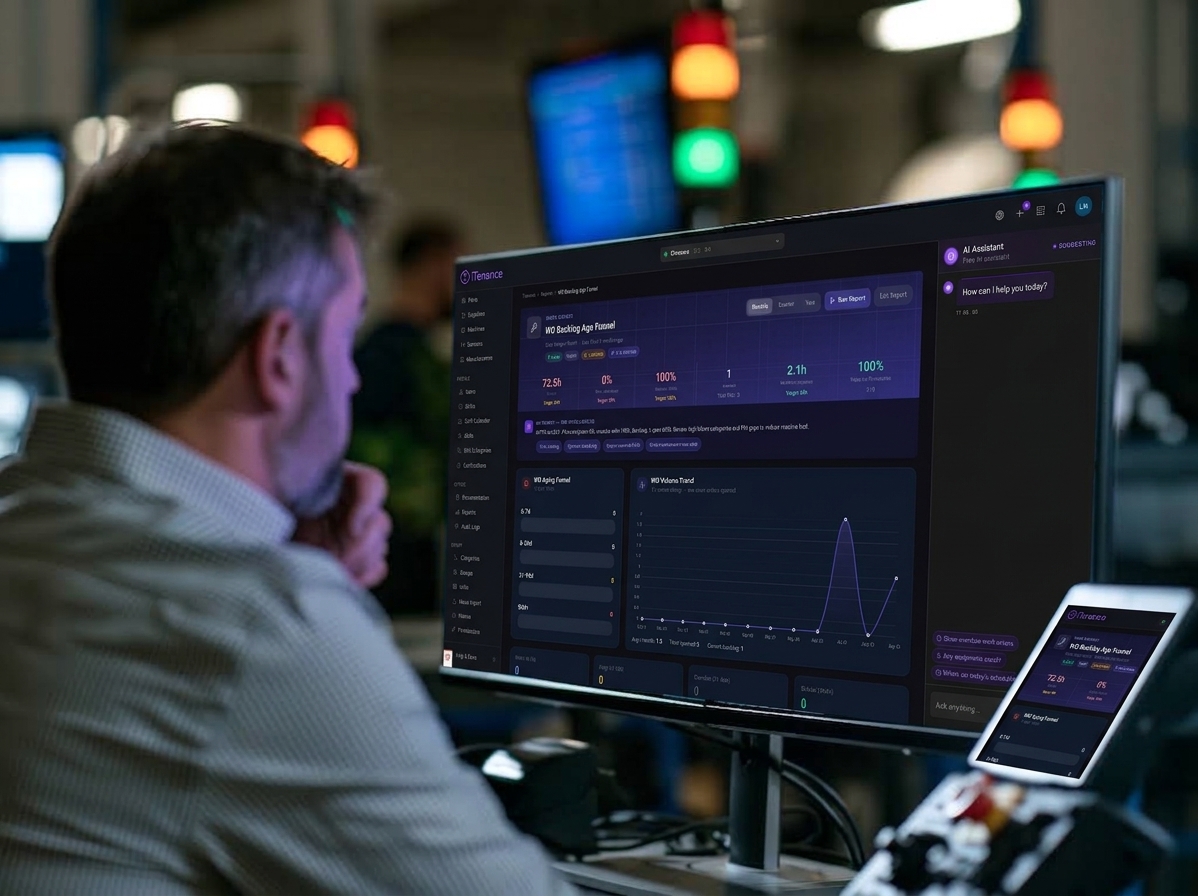
As the central operations manager, you access the iTenance reporting dashboard. Instead of sifting through emails or spreadsheets, you navigate to the Multi-Site view. This screen allows you to select both "Springfield Plant" and "Lakeside Plant" and compare their performance side-by-side using standardized KPIs.
- Downtime Comparison: You can see a real-time graph of total unplanned downtime hours for each plant. You immediately notice that Springfield's "Unplanned Downtime" for the month is indeed significantly higher than Lakeside's.
- Asset-Specific Performance: You drill down into "Asset Downtime by Type" and filter for "CNC Mills." The Haas VF-2 at Springfield clearly stands out with multiple critical failures and high accumulated downtime, whereas Lakeside's CNC machines show far fewer unplanned events. For press brakes, both plants show similar, lower levels of unplanned downtime, confirming the Amada issue at Lakeside is not part of a larger trend.
- Maintenance Costs: The "Maintenance Cost by Asset Category" report shows you that Springfield's spending on reactive repairs for CNC equipment is disproportionately high compared to Lakeside. This isn't just about parts; it includes technician labor costs tracked per work order.
- Work Order Backlog: You can compare the number of open work orders and their average completion times across both sites. Springfield might have more open critical work orders, indicating a higher reactive workload and potential resource strain.
With this comparable data, you can now see that Springfield is genuinely struggling more with critical asset reliability, particularly with its CNC mills. The Haas VF-2's recurring spindle bearing issues are a clear red flag. This isn't just "Mark being loud"; it's data-driven insight. You can then investigate further: Is it an environmental issue at Springfield affecting bearings? Is it an operator training gap? Or is it simply time to consider a major overhaul or even replacement for that specific machine?
The multi-site premises management capability transforms anecdotal observations into actionable intelligence. You move from guessing to knowing, allowing you to prioritize capital expenditure, allocate maintenance resources, and implement targeted preventive maintenance strategies where they will have the greatest impact across your entire organization.
The first practical step you can take this week is to simply map out your current assets across all your sites. Get a list of every major machine at Springfield, Lakeside, and any other plants. Note down their make, model, and primary function. This initial inventory will give you the raw data you need to start building a unified asset registry in a system like iTenance, laying the groundwork for true multi-site visibility.
الأسئلة الشائعة
How does multi-site premises management help with budgeting?
By providing comparable data on maintenance costs, downtime, and asset performance across all locations, you can accurately identify which plants or asset types are costing the most in reactive repairs. This insight allows you to allocate maintenance budgets more effectively, prioritizing investments in preventive maintenance, training, or equipment upgrades where they will yield the greatest return across your entire operation.
Can I compare technician performance across sites with this feature?
While the primary focus of multi-site premises management is on asset and premises performance, the underlying work order and people management capabilities track technician assignments and completion times per work order. By standardizing work order logging across sites, you can generate reports that compare average work order completion times or workload distribution for maintenance teams at different locations, offering insights into potential staffing or training needs.
What if our plants use different types of machines? Can they still be compared?
Yes, the system allows for comparison at various levels. You can compare overall plant performance (e.g., total downtime, overall maintenance costs), or you can compare specific categories of assets (e.g., all CNC mills across all sites, or all press brakes). Even if one plant has different machines, you can still compare overall operational efficiency and maintenance resource utilization.
How long does it take to set up multi-site management?
The initial setup involves defining each premises in the system and then populating the asset registry for each location. The time it takes depends on the number of assets and sites. However, the process is designed to be straightforward, and you can start with critical assets at one site and gradually expand, immediately gaining benefits from standardized data collection.
الوسوم
Laszlo Habensusz
المؤلف
مشاركات ذات صلة

Why Do Our New Maintenance Technicians Take So Long to Get Up to Speed?
Sep 14, 2026 · 8 min read
Machine Down: Why Do We Always Find Out We're Out of Spares Mid-Repair?
Aug 16, 2026 · 7 min read
A 10-Minute Walkthrough That Shows Where Your Maintenance Requests Really Go
Aug 11, 2026 · 8 min read
هل أنت مستعد لتحسين صيانتك؟
ابدأ تجربتك المجانية لمدة 30 يومًا اليوم. لا تتطلب بطاقة ائتمان، ولا توجد رسوم خفية.